

“In a time when you can work on Line P data without actually being to sea, who here has been to Station Papa?” About 2/3 of the hands in ~100 person room go up. “Who’s been since 2000?” 40 hands. “Who went in the 90’s?” 20 hands. “In the 80’s?” 10 hands. ” In the 70’s?” 5 hands. “In the 60’s?” Still, 2 hands go up. “Who’s been in winter?” 15 hands up, a hearty “Thank You!” and a round of applause from the room.
This was the amazing group that I was surrounded by at the two day meeting celebrating 60 years of science on Line P at the Institute of Ocean Sciences in Sidney, BC the last grey days of November, 2016. In this room sat some of the great forethinking oceanographers of a generation that have tirelessly pushed for continued funding, and collected samples, at what is now the longest continuously monitored station in the entire global ocean.

Ocean Station Papa as it is currently known, originally began as Ocean Weather Station Peter at 50°N 145°W during 1942 as transoceanic flights were increasing in volume. Weather observations during this era was exceedingly difficult to obtain. The next weather data to the west of Peter was near Japan, a very long flight away. Station P was not the only weather station, but it was the northernmost of three in the Pacific and another 10 were in the Atlantic. The weather station was occupied on and off during the war by the Coast Guard Cutter Haida and while weather observations were the primary goal, an oceanographic program to measure the daily water column structure using bathythermographs began in the last days of 1949.

Somewhere along the way, the station was renamed Papa and a Canadian vessel replaced the US weathership in 1951 as the budget constraints ended the US ability to maintain operations. During the transition, a brief gap exists in the oceanographic temperature record at Papa, but this again became a twice daily occurrence in July 1952. It wasn’t until July 1956 that regular hydrographic stations were established along the line between the coast and Papa and samples from the water column were collected to ~1200 m. This is the true beginning of the useful observations that we now consider to be the 60 year record that assembles into the Line P dataset.
This dataset is the longest continuous record of ocean monitoring in the same location in the whole world. So what has all that data taught us? A lot. From the natural variability of temperature and salinity through the seasons, to how these parameters are changing on longer timescales with climate change, Line P operations have proven to be an excellent platform for understanding the NE Pacific and the human role in our changing environment.

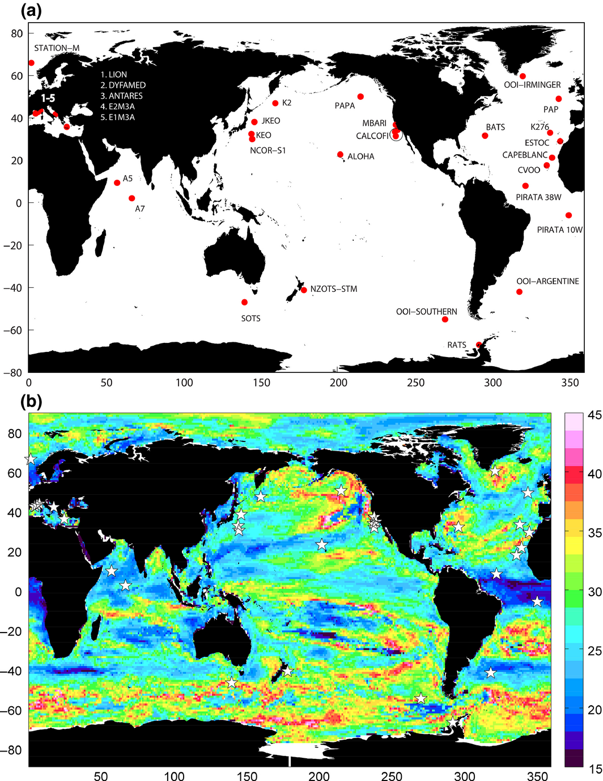
While the Line P research cruises are essential for short term experiments in the NE Pacific, it is only through the endurance of this regular monitoring program that it is possible to determine long term changes from natural variability. In fact, a recent computer model looked at observations from around the global ocean in an effort to determine the minimum length of a time series to discern the difference between natural variability and climate change. As you may imagine, if natural oscillations are of great amplitude and long duration, the more data is needed to determine if a real trend exists. Their results highlight that the NE Pacific is a very dynamic place with influences from Pacific Decadal Oscillation (20-30 year oscillations), North Pacific Gyre Oscillation (10-15 year oscillations), and shorter phenomenon as well. Therefore, a lengthy 35-40 year record is necessary to establish a climate change-related trend in a dataset.
Fortunately, station Papa has had observations for ~50% longer than that minimum and science and society are now benefiting from the great human and financial investment from the Canadian government to maintain these observations. This extensive record makes station Papa one of the most valuable time series in the world and that value makes it a prime location where next generation observations are taking place.
Currently, NOAA and the National Science Foundation funded Ocean Observatories Initiative from the US have multiple buoys and autonomous underwater gliders that provide near real-time data from the site (NOAA data and OOI data). NASA is also currently scheduling the first ExPORTS experiment to occur at Station Papa. This large undertaking will involve multiple ships coordinated with satellites to determine how satellite observations may be used to estimate phytoplankton primary production, a vital measure of ocean health that is currently only possible to ascertain with multiday bottle experments aboard research vessels. More real-time monitoring at station P will ensure the continued value of this dataset for future research.

In addition, Fisheries and Oceans Canada has a continued commitment for three research cruises a year, in February, June, and August, as part of their ongoing monitoring efforts. InFORM is just one of many current programs that take advantage of these regularly scheduled cruises. The results from this work provide a 1-2 year forecast for the intensity of the Fukushima plume before it arrives on the BC coast. Before InFORM was even a concept, the Smith Lab from the Bedford Institute for Oceanography was collecting preliminary samples to determine if Fukushima contamination would likely be at measurable levels. These results laid the groundwork for the InFORM network that you see today.
We thank all those at Fisheries and Oceans Canada, the Institute for Ocean Sciences, and the Pacific Biological Station, among many others, that have come before who were instrumental in maintaining Line P observations and funding regardless of the federal climate. It is a massive undertaking, but if the current research highlights show us anything, it is that the greatest results may be yet to come.

To learn more about Line P operations and research mentioned above, see: WaterProperties.ca/LineP. History courtesy Freeland 2007.

2 thoughts on “A Diamond Jubilee for Line P”