
What do we detect and how do we quantify radioactive cesium isotopes?
InFORM is measuring two radioactive isotopes, cesium-134 (134Cs) and cesium-137 (137Cs) that were released by the disaster at the Fukushima Daiichi Nuclear Power Plant. While these two isotopes have the same number of protons, they differ by 3 atomic mass units due to 3 more neutrons in 137Cs. Both isotopes emit gamma photons as they (or their daughter isotopes) undergo radioactive decay.
Gamma rays are pure electromagnetic radiation. More energetic than x-rays, gamma photons emitted during decay penetrate some materials. Since the structure and energy levels of each isotope are unique, the gamma photon energy emitted during 137Cs decay is different from that of 134Cs decay, and from the energy of other radioisotopes. As a result, we use this energy ‘fingerprint’ to identify which radionuclide is emitting the gamma photon. Each photon from a sample is ejected from the atom and, if in a detector, may interact with a semi-conducive germanium atom (Ge). If you count the number of photons interacting at each energy level over a period of time in the detector, it is possible to determine the number, and type, of radioactive atoms in a sample.
What does a gamma detector look like?

This gamma spectrometer has been taken apart so that you may see the large crystal of pure germanium metal and two electrodes inside. When a photon hits the crystal, it produces a tiny electrical current. The electrons move in the large voltage gradient within the crystal and the tiny current flows through the electrodes to an amplifier. The amplifier increases the signal strength and converts this to a stable, digital, voltage signal. Each gamma photon produces one pulse analogous to a flash of light from one pixel of a cell phone.
Two important parts of the detector, not shown in the photo, are the sealed vacuum and the ‘cold finger’. The vacuum surrounds the crystal and stabilizes the immediate environment around the detector, prevents sparks, and reduces the background electrical current in the crystal. The cryogenic cooling system, or ‘cold finger’, is a rod of copper metal inside the vacuum system immersed in a container full of liquid nitrogen, at -196 oC. This cooling system extends below the detector crystal and reduces the electrical current that leaks across the crystal. If the germanium crystal were allowed to warm up to room temperature, leaking current would produce a very high number of erroneous counts, or background counts, that are not from the sample. The ability to distinguish photons of cesium from other radioisotopes is also lost at room temperature.

The gamma detector, along with the sample to be measured, are placed inside a large cylinder mostly made of lead with 10 cm thick walls. This thick, dense, metal shields the detector from any gamma photons generated by materials outside the box.
What is seen during a measurement?
Given the low levels of radioactivity that we have been observing in the samples of seawater and fish, each individual sample needs to be in the detector for 1-3 days to get an accurate measure of the radioactive cesium present. After that time, we have counted enough photons to determine if 137Cs and/or 134Cs are present and in what concentration.
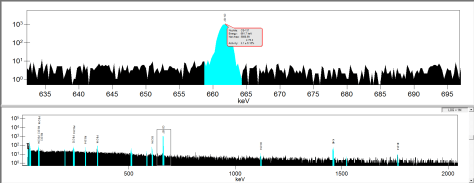
The detector records all of the gamma photons that strike the germanium crystal in an energy spectrum (above). The peak shown is from 137Cs photons emitted from a standard used in calibration that was in the detector for 26 hours. In the lower panel, you can also see highlighted energies from gamma photons of other isotopes that hit the detector during the sample run. These photons, from potassium-40 (K-40) and lead (Pb-214), for example, are at higher and lower energies than the 137Cs photons.
How do you calculate the amount of Cesium-137 in a sample?
The spectrometer counts the photons that strike the detector and records the energies. Using this information we determine the number of photons from each isotope. However, many cesium photons do not strike the detector. We use a ‘standard’ sample, with known amounts of 134Cs and 137Cs, to account for this difference by determining the fraction of cesium photons that strike vs miss the detector. Using this detector fractional efficiency, we calculate the total number of 134Cs and 137Cs atoms in the sample. These are the values reported on the InFORM website. To validate our findings, calculations of efficiency are also independently verified using a numerical model of cesium photon behaviour.
How do you calibrate a new gamma spectrometer?
To keep pace with the number of samples generated over the duration of the InFORM project, a new gamma spectrometer was purchased. This particular detector was chosen in part because of its well-shaped germanium crystal that effectively surrounds the sample. This geometry increases the sensitivity of the instrument and lowers the minimum detection threshold.

After setting up the instrument, the manufacturer works with the new operators on site for a week, or more, to explain the nuances of the new machine. In the case of this specific detector, the size of the germanium crystal is rather unique and posed some challenges. The manufacturer continued to work with the scientists at U Ottawa to tune the hardware and software to properly resolve the radioactive standard reference materials (SRMs) to within the design specifications for accuracy and precision. At the University of Ottawa Advanced Research Complex, we use SRMs that range from water that has been spiked with known amounts of radioactivity to spinach grown near Chernobyl that has a high and well defined Cs-137 signal. In the figure, you can see above how well we matched up with these SRMs that were produced by the National Institute of Standards and Technology and ensure calibration over a range of photon energies and radionuclide concentrations. This calibration process is not straight forward and many iterations are necessary to troubleshoot challenges as they arise. However, once completed, the instrument should remain stable and only require validation of calibration periodically every other month.
In addition to the international standards, InFORM scientists cross-calibrated the new detector with other detectors used to produce results for our monitoring program. The cross-calibration is done by analyzing the same sample on multiple detectors, comparing the results, and resolving differences. Through this iterative process we ensure that the new spectrometer meets international standards and all results from it are directly comparable to existing results from other aspects of the research program.
