

To monitor for bioaccumuluation of radionuclides in seafoood, the InFORM program has partnered with many of British Columbia’s First Nations communities to obtain fish for radionuclide analysis. In 2015, 11 First Nations contributed 10-30 salmon and steelhead trout from waters in their territory for processing.

Whole fish are delivered to the Pacific Biological Station in Nanaimo (part of Fisheries and Oceans Canada), and are processed by Dr. Marc Trudel (head of the Salmon Marine Interactions Section) and staff.
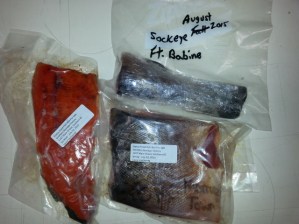
Vital information about the sample such as species, weight, length, gender, etc. are recorded and then, a ~125 g sample of muscle is bagged and numbered. Samples are flash frozen and prepared for shipping to Health Canada’s Radiation Protection Bureau.
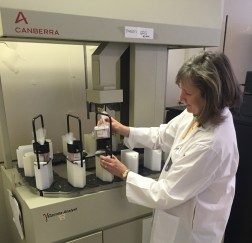
At Health Canada’s Radiation Protection Bureau (RPB), samples are homogenized (blended) before being placed in an analysis container on the gamma spectrometer where they are analyzed for ~6 hours each. Samples testing positive for low levels of 137-Cs or 134-Cs remain on the detector for a longer duration to increase the precision of the measurement.
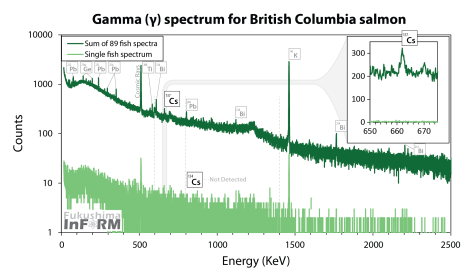
Once the gamma spectrum for each sample is obtained, these spectra are examined to determine the presence or absence of the Fukushima radionuclides, 137-Cs and 134-Cs. While an individual sample may not have detectable levels of these isotopes, the spectra of multiple fish samples from the same location, or time, can be added together to detect the presence of radionuclides in the samples at lower concentrations.
In environmental samples where very low levels of radioactivity are encountered, the question arises as to whether an observed signal is real or not. To simultaneously safeguard against the possibility of a false positive assessment (i.e. the analyst makes a positive identification when in fact there is no real activity present) and a false negative assessment (i.e. the analyst decides there is no activity when in fact there is), an activity level is statistically derived to ensure that either scenario is highly unlikely (< 5%). This activity level is referred to as the minimum detectable concentration (MDC). The MDC is an expansion of the critical limit (Lc), which is used to assess signals in consideration of false positive scenarios only. As such, activity measurements between Lc and MDC hold merit and are therefore reported.
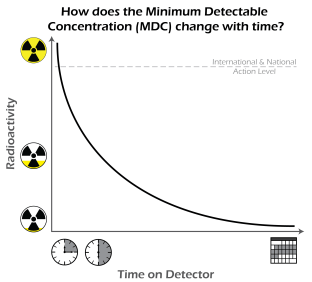
A more detailed investigation is possible, but requires that the minimum detectable concentration (MDC) be lowered. When studying ionizing radiation, the MDC is a threshold that refers to the statistics of detecting individual nuclear disintegrations after a sample has been on a detector for a period of time. With each additional disintegration detected, the signal becomes more distinct from the noise. When detecting trace concentrations of isotopes, disintegrations are infrequent and thus more time on the gamma spectrometerdetector is necessary to lower the MDC and determine with confidence (signal clearly, and statistically, above the noise) that an isotope is present. Lowering the MDC is analogous to increasing the exposure time for a camera to capture a good night scene as shown below.

To improve the resolution similar to a camera’s zoom, samples are freeze dried, to prevent the meat from going rancid, then placed on the detector for a longer duration. For our salmon samples they remain on the detector for a full two weeks (336 hours), signifcantly longer than the initial detection run of 6 hours. Similar to the photos above, after 6 hours on the detector, you can just see the night scene of a beach with a campfire. In the case of those 8 samples, it was even possible to see that something was present, as within the photographs red highlighted area, but there is not enough signal to clearly resolve what that item might be. When placed on the detector for 2 weeks the decay signal is improved and the MDC threshold is lowered, similar to decreasing the shutter speed to allow more light to be captured by the camera’s sensor when it becomes clear that the faint signal in the dark image are logs on the beach.
This additional analysis provides more statistically robust results and therefore we have greater confidence in the signal.
The Importance of Salmon to Canadians
Pacific salmon are economically, culturally, and ecological significant species to British Columbia. On an annual basis, the commercial, recreational, and First Nation salmon fisheries contribute over $600 million in revenues. They are an important food source to First Nations and coastal communities. In addition, salmon feed numerous animal species such as endangered Killer Whales, Gray Wolf, Grizzly Bear, seabirds, and insects. They provide nutrients to freshwater ecosystems and riparian habitats through the decomposition of their carcass.
There are six species of Pacific salmon in British Columbia. The InFORM network will focus primarily on Sockeye Salmon (Oncorhynchus nerka) and Steelhead Trout (Oncorhynchus mykiss), though other salmon species have and will be examined. Both species typically spend 2-3 years in the North Pacific Ocean prior to returning to their natal streams and venture further west than any other salmon species (Figure 1-2). On an annual basis, 1-10 million Sockeye Salmon are commercially harvested for human consumption and ceremonial purposes. In contrast, the fishery for Steelhead Trout is primarily catch and release due to conservation concerns for this species, particularly in Southern British Columbia. Although wild Steelhead Trout are not frequently consumed in Canada, their extensive westward migration that brings them close to the coast of Japan makes them an ideal canary species for monitoring radiation levels in salmon species originating from British Columbia.


Technical Information Regarding Sample Analyses
- Gamma-radiation emitting isotopes were measured by gamma spectroscopy using a high purity germanium detector and each sample being counted for 6 hours
- Planar BE5030 high purity germanium (HPGe) detector with relative counting efficiency of 46%
- Counting geometry = Parkway Jar (Polyethylene, active volume = 129 mL) placed in a polyacrylate sample holder (2.95 mm thickness)
- Counting efficiency was determined by applying an empirical efficiency curve, determined from a multi-nuclide (12) standard (Eckert and Ziegler Analytics, SRS: 79535-411) of similar density (1.15 g/cm^3, Parkway Jar format) spanning energies of 46.5 – 1836.1 KeV
- True coincidence summing (where applicable) is accomplished by extracting detailed decay scheme data from the UniSampo-Shaman nuclide library
- Spectral summation was done by adding all the spectrum into a single one and then reanalysed using UniSampo-Shaman gamma spectral analysis software from Baryon Oy, Ltd., Finland, with decay correction to the catch date
Sockeye photo credit: J Ching.
