

We all know that boy who just keeps pestering and won’t quite go away, right? Well the winter of 2015-2016 saw one of the largest El Niños on record hit the Equatorial Pacific….and it just won’t go away. While the weatherpersons on the news were quick to make connections between atmospheric patterns and El Niño, I didn’t see any mentions about the effects it would have on our coastal waters. After all, El Niño is an oceanic phenomenon so it would make sense that there would be a local marine effect, right? It turns out that while El Niño is on its way out and predictions of La Niña are on the rise in equatorial waters, the Salish Sea is just starting to feel the effects of the monster that was.
Studies looking at the temperature and salinity of coastal BC and Washington waters have found that it takes up to 10 months before the temperature signal is felt in the deeper waters of the Strait of Georgia. The time lag is a result of the mechanisms utilized to transmit that signal all the way from the equatorial Pacific to the NW coast.
If you are unfamiliar with what causes El Niño, here’s a pretty good primer for those who like to read and those who like to watch (below).
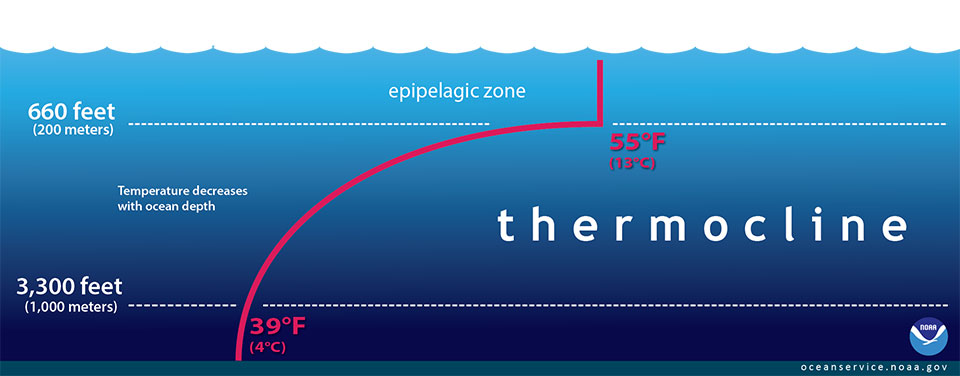
Something that video doesn’t talk about, but is very important to what makes El Niño work are Kelvin waves. Did you notice how the warm pool of water shifted across the Pacific during El Niño conditions? Each of those shifts is due to a Kelvin wave (or many) perturbing the thermocline, or the depths of the ocean where the temperature changes most rapidly.
The following video is a demonstration of what happens when you relax/remove a barrier between separated warm and cool pools of water.
Generally, the sharp interface between the temperatures is the thermocline and this interface wiggles up and down in a Kelvin wave-like fashion. As you may imagine, there are lots of details to how a Kelvin wave works, and here is a more complete explanation if you’re interested, but the broad brush is that Kelvin waves move from east to west along the equatorial thermocline and, in moving the thermocline, these waves allow for the shifting of warmer surface (and colder deeper) waters in the process. When those waves along the thermocline hit the coast of South America, the energy doesn’t reflect (due to physics), but instead the wave splits and travels north and south along the coast of the American continents looking something like this.
Where the part of the wave with the highest amplitude (most wiggly part) is representing the movement of the thermocline up and down in the water column right against the coast. These waves take ~20-30 days to reach the waters of the Pacific Northwest and they may perturb the thermocline up to ~100 m in some cases. It is these perturbations to the thermocline that allows warmer surface waters to pool offshore BC waters and then transit the Strait of Juan de Fuca.
Now, I should mention that the offshore waters at this point are already primed to be different than normal due to El Niño altering the storm track, which ultimately reduces mixing of the regional surface ocean. It’s important to mention this because the ocean and atmosphere are intimately linked and together they influence local, regional, and global climate.

From the coast, it takes on average about 6-7 months for the circulation of offshore waters to fully penetrate the intermediate layer of the Strait of Georgia. The surface layer responds more quickly, again due to its contact with the atmosphere and exposure to daily conditions (generally warmer and slightly wetter in the region during El Niño years).
Back at the equator, El Niño usually peaks sometime in the November – January period and an analysis shows that the waters of the Salish Sea have their strongest correlation with El Nino during that same winter and persisting for up to three seasons later.

So now we know that the signal from El Niño is currently in the Salish Sea throughout the Summer of 2016, but how big of a signal are we talking about? Could El Niño be to blame for the recent sightings of fish and dolphins that aren’t normally seen in these waters? The same study answers the question with the following figure.

You can see that during the winter (on the left), average temperatures do shift by ~1 °C between La Niña and El Niño years, but that there is no noticeable El Niño effect during the summers (on the right). The observed variability highlights the dominant effect of local weather patterns during the year and means that while it’s tempting to point to rarely seen animals in local waters and say that El Niño is to blame, it really isn’t that simple.

While El Niño is unlikely to be the direct cause of warmer than normal local waters this summer, the waters remain warmer than average across much of the Pacific as seen from satellite observations. These conditions may well be a resurgence of warm waters from ‘The Blob.‘ While the winter storms put a big dent in cooling the sea surface, it appears that they failed to remove the heat that had accumulated at depth…almost like a half stirred coffee cup. Time will tell how long The Blob will remain an influence offshore, but it will take at least another winters worth of storms to remove the heat that remains.
So, before you blame your fishing results on a lingering little boy, shift that finger to poking the lazy giant blob.
You can always find the latest information on The Blob through the Alaska Blob Tracker.
