
Coastal monitoring: Results from 20 samples, mostly collected in November – January, did not find any of the Fukushima fingerprint isotope, 134Cs (2 year half-life), in coastal waters. Low levels of 137Cs (~30 year half-life) were present in all of the samples. These new data continue to lie along the increasing trend which indicates that the leading edge of the Fukushima plume is in BC’s coastal waters.

The above trend is clear and shows a steady rise that would predict that the average sample will have double the initial background concentrations of 137Cs by this coming summer. While still far below the 10,000 Bq m-3 level of concern for cesium radionuclides in drinking water, these more contaminated samples should also more regularly contain the Fukushima fingerprint isotope, 134Cs.
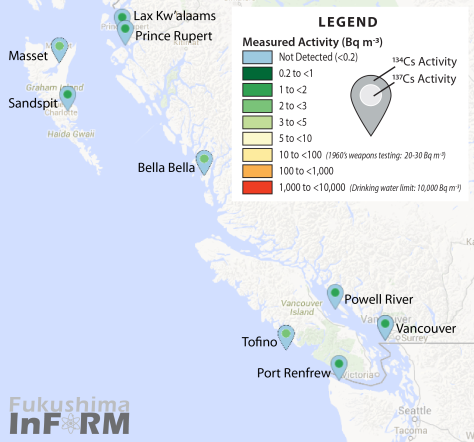
While the increasing 137Cs trend is clear for the whole coast, it is also evident that each region is telling the story of how ocean waters circulate in coastal British Columbia. To conduct this regional analysis, we grouped InFORM communities together as follows:
- Haida Gwaii / North Coast: Lax Kw’alaams, Prince Rupert, Masset, Hartley Bay, Sandspit
- North Van Is / Central Coast: Bella Bella, Port Hardy, Winter Harbour
- West Coast Van Is: Tofino, Ucluelet, Bamfield
- Strait of Georgia: Powell River, Vancouver, Salt Spring Island
- South Van Is: Port Renfrew, Victoria
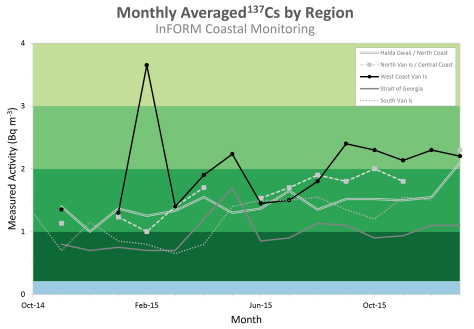
From this, it is clear that the West Coast of Vancouver Island has received the highest levels of Fukushima contamination, which makes sense given their exposure to the oceanic waters. We also see that those same offshore waters have yet to be transported into the Straight of Georgia and these inland waters are clearly a different water mass. Given that some locations in the Strait of Georgia can be over 400 km from the mouth of the Strait of Juan de Fuca and it makes sense that it would take considerable time for the waters to transit this length. In fact, the estuary known as the Salish Sea, which encompasses the Strait of Juan de Fuca, Haro Strait, Strait of Georgia, and Puget Sound, has a rather long flushing time who’s duration depends on many environmental factors and your location. Before we get to total transit times though, we need to understand that estuaries like the Salish Sea have a very distinct circulation pattern.
In glacially carved fjords like the Salish Sea, salty and dense ocean water flows into the estuary along the seafloor of the basin. Meanwhile, fresher, and lighter river influenced water heads out to sea at the surface. On its journey landward, ocean water has to get over a sill, or topographic high (located locally near Victoria and the Gulf/San Juan Islands), before getting all the way into the main basin of the fjord.

Generally speaking, it takes incoming waters about a month to transit from Cape Flattery through the Strait of Juan de Fuca and Haro Strait. By the time ocean waters get this far, about 80% has already been mixed into the surface layer and is heading back out to sea. Depending on the season, incoming waters may become a layer at intermediate depth or, if cold and dense enough, they may become deep basin waters. These intermediate and deep waters slowly spread throughout the Strait of Georgia and may take up to half a year before they are mixed into the fresher and less dense surface waters. These brackish surface waters then make the return trip back to the coast which may take up to 2 months to complete.
This circulation pattern helps explain why the stations within the Strait of Georgia have such a minimal signal to date. While it would appear that the surface waters of Outer Vancouver Island were beginning to see a steady climb in 137Cs beginning in spring 2015, the oceanic waters that are the origins of this signal have likely been slowly transiting the fjord at depth. Given the small fraction of ocean water that makes it all the way into the Strait of Georgia, it may be later in 2016 before there is a notable increase in the concentrations of 137Cs from samples at our InFORM communities along the Strait.
If you examine the figure of regional trends, you will note that each region seems to follow a slightly different trend. These differences highlight the utility of this biologically inert tracer to understand the circulation and transit times of marine waters around Coastal BC. We’ll explore other cases in future newsletters.

The deep inflow water in Juan de Fuca is from relatively deep in the coastal ocean >100 m. Unlike the schematic, the open ocean is also stratified, and it is unlikely much surface water is drawn into Juan de Fuca, and hence into the Strait of Georgia. I’d be very surprised to see significant surface signatures from Fukushima in the Strait of Georgia. If it does, it means there has been significant vertical mixing of the plume, which would be an interesting thing to measure in the open ocean.
LikeLike
Hi Dr. Klymak,
Based on observations at 152 W and Station P (and other Line P stations), the 134-Cs and 137-Cs has been mixed throughout the surface layer to depths of ~300 m along its journey through the Kuroshio extension and the North Pacific Current. Therefore, there should be waters at depth that would be entering the Strait. You can see in Smith et al. 2015 (https://fukushimainform.ca/2014/12/29/observing-the-arrival-of-the-fukushima-contamination-plume-in-north-american-coastal-waters/) that even the leading edge of the plume extended down to depths of ~100 m. We are working with modelers like Vincent Rossi to compare how the observations are differing from their initial forecasts. In their 2013 paper (http://web.science.unsw.edu.au/~matthew/Rossi_et_al_DSR_2013.pdf) the Rossi model estimates that mixing should occur to depths of ~400-500 m at 140 W, so perhaps given our observations vertical mixing was less intense over the period than the model suspected. This seems to make sense given the Blob and other conditions in the NE Pacific, right? Anyways, based on the current observations, I think it makes sense that there would be inflowing plume water at depth in the Strait, but it will be interesting to see if the observations match up with the transport and box model estimates put forward by Pawlowicz et al. (2001, 2007).
I personally apologize for the imprecise figure for estuarine circulation. I plan on making a more accurate, case specific, graphic in the near future.
Thanks so much for the feedback,
Jonathan Kellogg
LikeLike